Edrawmax diagram center
Welcome to EdrawMax Diagram Center, with 210+ diagram types to create exceptional, field-setting diagrams.

All-in-one platform
Select from 210+ types of diagrams, ranging from simple flowcharts to intricate network diagrams, and quickly master their creation within minutes.
Diagram Type
Trending Searches:
{{ list.title }}

P&ID

Architecture Diagram

Scientific Diagram

Process Flow Diagram

Visio Alternative

Infographic
Gantt Chart

Value Chain Analysis

SWOT
UML Diagram
Biology Diagram

Office Layout
Electrical Design
Evacuation Plan

Map
Street Map
P&ID
House Wiring Diagram

2D Floor Plan
Location Map
Blueprint Design

Neural Network Diagram
Ladder Diagram
Pedigree Chart
Phylogenetic Tree
Wardrobe Design
Wireframe
Plumbing Design
Pedigree Chart
Table Chart
Schematic Diagram
2D Architecture Design
CCTV Network Diagram
Data Flow Diagram
Elevation Plan
Elevation Plan
Store Layout
Pert Chart
Decision Tree
Work Breakdown Structure
Block Diagram Maker
Class Diagram Maker
Radar Chart Maker
Funnel Chart Maker
Seating Chart tools
AI Brochure
AI Flyer
AI Poster Maker
Crime Scene Investigation Software
EdrawMax vs. rivals: A comparison
Discover the unique features and unmatched capabilities that set
EdrawMax apart.
Explore EdrawMax templates

Data flow diagram
A data flow diagram illustrates the way information
flows through a process or system.

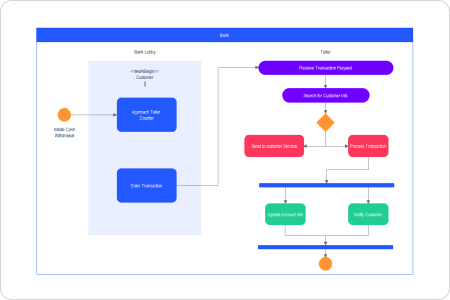
Swinlane diagram
A Swimlane diagram is a type of flowchart that
defines who does what within multi-departmental
processes.
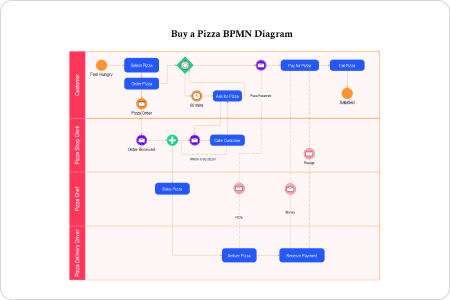
BPMN
BPMN (Business Process Modeling Notation) is a
graphical method of representing business processes.

Process flowchart
A process flowchart is a fundamental representation
that can explain the steps making the business
successful.
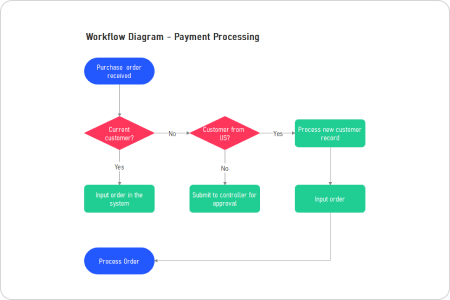
Workflow diagram
A workflow diagram visually displays the movement
through the entire work process for a certain
product or service.

Process flow diagram
A process flow diagram (PFD) demonstrates the
ongoing production flow of chemicals and equipment.

Data flow diagram
A data flow diagram visualizes the flow of
information within a process or system, showcasing
the journey of data.

Swinlane diagram
A Swimlane diagram categorizes and clarifies
responsibilities across multiple departments.

BPMN
BPMN (Business Process Modeling Notation) employs
graphical elements to depict and model business
processes effectively.

Process flowchart
A process flowchart is a foundational visual
representation that effectively illustrates the
steps for achieving business success.

Workflow diagram
A workflow diagram visually captures the entire
journey of a product or service through the work
process.

Process flow diagram
A process flow diagram (PFD) provides a visual
representation of the continuous production flow
of chemicals and equipment

Home plan
Home plan is the document that contains the
specifications a builder and contractor to build a
house.

Office layout
Office layout is the blueprint of the office floor
designed to help your employees more efficient in
their tasks.

Seating chart
Seating chart is a visual illustration of the
seating arrangement in a corporate or personal
event.

Garden design
Garden design is the process of designing and making
plans for layout and planting of gardens.

Fire evacuation plan
Fire evacuation plan is a documented strategy that
explains the procedure that must be followed if fire
breaks out.

Wardrobe layout
Wardrobe layout is a blueprint for space with a door
used for storage, particularly that of clothes.

Home plan
Home plan is the document that contains the
specifications a builder and contractor to build a
house.

Office layout
Office layout is the blueprint of the office floor
designed to help your employees more efficient in
their tasks.

Seating chart
Seating chart is a visual illustration of the
seating arrangement in a corporate or personal
event.

Garden design
Garden design is the process of designing and
making plans for layout and planting of gardens.

Fire evacuation plan
Fire evacuation plan is a documented strategy that
explains the procedure that must be followed if
fire breaks out.

Wardrobe layout
Wardrobe layout is a blueprint for space with a
door used for storage, particularly that of
clothes.

Electrical diagram
An electrical diagram is a type of technical drawing
that delivers visual representation of electrical
systems.

Circuit diagram
A circuit diagram is a visual representation of a
complete circuit of an electronic or electrical
equipment.

Logic diagram
A logic diagram shows how different types of gates
are connected to form a digital circuit to perform a
task.
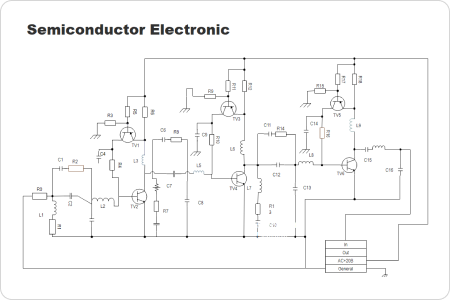
Schematic diagram
A schematic diagram represents the elements of a
electrical system with abstract and graphic symbols.

Wiring diagram
A wiring diagram is simply a pictorial
representation of all the electrical connections in
a specific circuit.

Ladder diagram
A ladder diagram is a drawing of the logical
structures of industrial equipment.

Electrical diagram
An electrical diagram is a type of technical
drawing that delivers visual representation of
electrical systems.

Circuit diagram
A circuit diagram is a visual representation of a
complete circuit of an electronic or electrical
equipment.

Logic diagram
A logic diagram shows how different types of gates
are connected to form a digital circuit to perform
a task.

Schematic diagram
A schematic diagram represents the elements of a
electrical system with abstract and graphic
symbols.

Wiring diagram
A wiring diagram is simply a pictorial
representation of all the electrical connections
in a specific circuit.

Ladder diagram
A ladder diagram is a drawing of the logical
structures of industrial equipment.
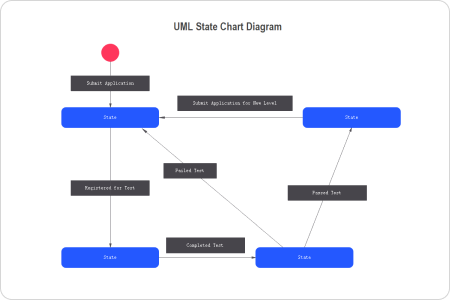
State diagram
A UML state diagram is a behavioral diagram used to
represent a system's conditions at a given time.

Class diagram
A class diagram is used for visualizing an
application and constructing code of the software
application.

Use case diagram
A use case diagrams are used to show the
interactions between actors and a system in unified
modelling language.

Component diagram
A component diagram describes how components are
wired to form larger components or systems.
Activity diagram
Activity diagram visualizes workflows of activities
and actions with support for choice, iteration and
concurrency.
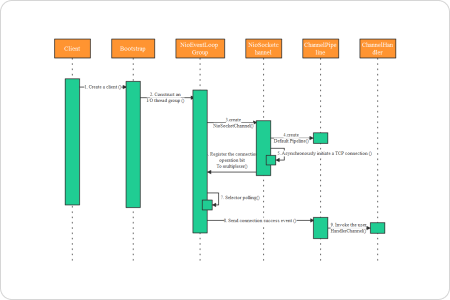
Sequence diagram
A sequence diagram is commonly used to depict
interactions between objects in a use case..

State diagram
A UML state diagram is a behavioral diagram used
to represent a system's conditions at a given
time.

Class diagram
A class diagram is used for visualizing an
application and constructing code of the software
application.

Use case diagram
A use case diagrams are used to show the
interactions between actors and a system in
unified modelling language.

Component diagram
A component diagram describes how components are
wired to form larger components or systems.

Activity diagram
Activity diagram visualizes workflows of
activities and actions with support for choice,
iteration and concurrency.

Sequence diagram
A sequence diagram is commonly used to depict
interactions between objects in a use case..

US government org chart
An org chart shows the US government structure which
helps to understand the whole structure and key
position.

Marketing org chart
An org chart helps marketing employees to find the
target workmate and key roles in the company.
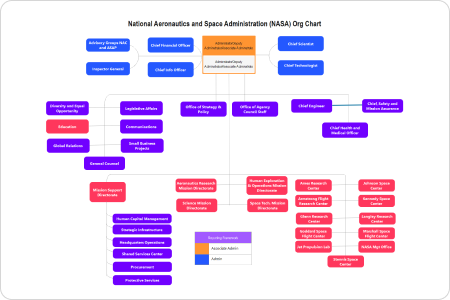
NASA org chart
An organizational chart shows the member structure
of the National Aeronautics and Space
Administration.

Circular org chart
An org chart shows the member structure from highest
level to entry-level by drawing from the center.

Matrix org chart
A matrix org chart is a type of diagram in which
people are divided into levels by administrative
power.

Tesla org chart
An organizational chart shows the member structure
of the employees at Tesla.

US government org chart
An org chart shows the US government structure
which helps to understand the whole structure and
key position.

Marketing org chart
An org chart helps marketing employees to find the
target workmate and key roles in the company.

NASA org chart
An organizational chart shows the member structure
of the National Aeronautics and Space
Administration.

Circular org chart
An org chart shows the member structure from
highest level to entry-level by drawing from the
center.

Matrix org chart
A matrix org chart is a type of diagram in which
people are divided into levels by administrative
power.

Tesla org chart
An organizational chart shows the member structure
of the employees at Tesla.

Air conditioning process P&ID
Air conditioning process P&ID shows the process
controlled by an integral and derivative controller
with a single loop.
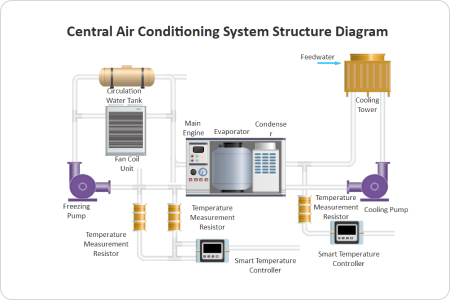
Engineering P&ID diagram
An engineering P&ID diagram visualize the workflow
of central air conditioning system structure.

Membrane cleaning unit P&ID
A P&ID diagram shows each component and its workflow
of the membrane cleaning unit.
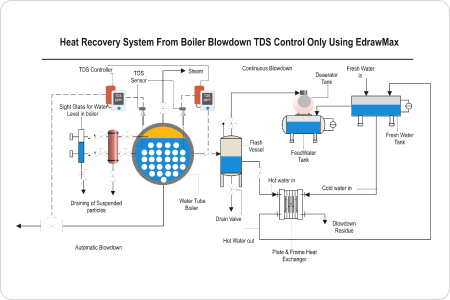
Heat recovery system P&ID
A P&ID diagram shows the process of heat recovery
system from boiler blowdown.

Biomass briquette production P&ID
A P&ID diagram displays the relationship between
major equipment of a plant facility.

Sand filter P&ID
A P&ID diagram shows the sand filter for multi-stage
filtration which is widely used for irrigation
purposes.

Air conditioning process P&ID
Air conditioning process P&ID shows the process
controlled by an integral and derivative
controller with a single loop.

Engineering P&ID diagram
An engineering P&ID diagram visualize the workflow
of central air conditioning system structure.

Membrane cleaning unit P&ID
A P&ID diagram shows each component and its
workflow of the membrane cleaning unit.

Heat recovery system P&ID
A P&ID diagram shows the process of heat recovery
system from boiler blowdown.

Biomass briquette production P&ID
A P&ID diagram displays the relationship between
major equipment of a plant facility.

Sand filter P&ID
A P&ID diagram shows the sand filter for
multi-stage filtration which is widely used for
irrigation purposes.
